Business AI field guide · Part 2 of 5
Best Perplexity Prompts for Business Data
Six prompts for useful numbers, better questions and fewer mysterious totals.
“Analyse this spreadsheet” sounds decisive until you discover it has treated a blank as a zero and counted the subtotal as another sale. Start with a smaller job and tell it what a row means. That one sentence has rescued more spreadsheets than any amount of enthusiastic charting.

Start with the data you can use
Perplexity supports file analysis on eligible accounts, including CSV uploads. Check your plan and workplace permissions first. For these exercises, use a fictional or approved sample. Remove irrelevant columns and supply the units, reporting period and meaning of one row. Use a clean export with a single header row if possible.
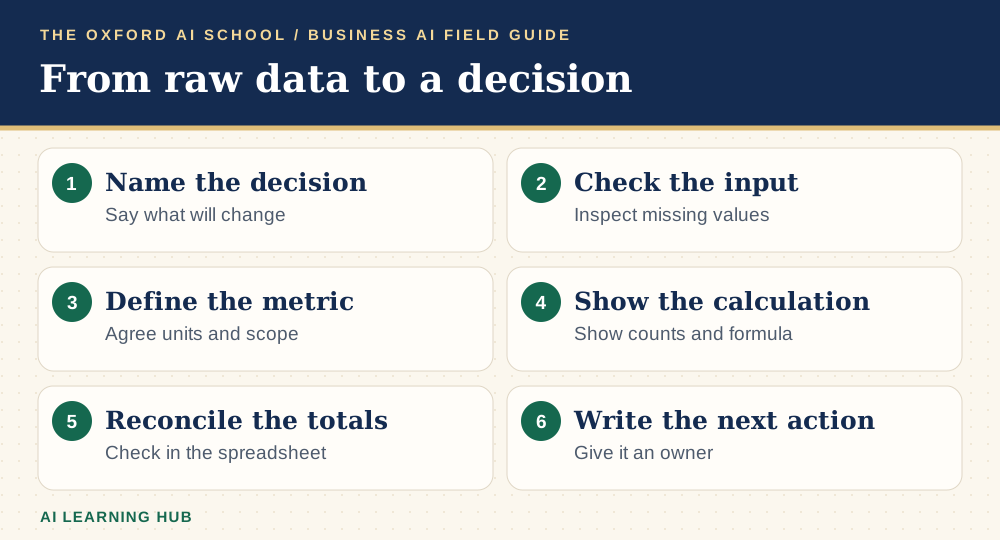
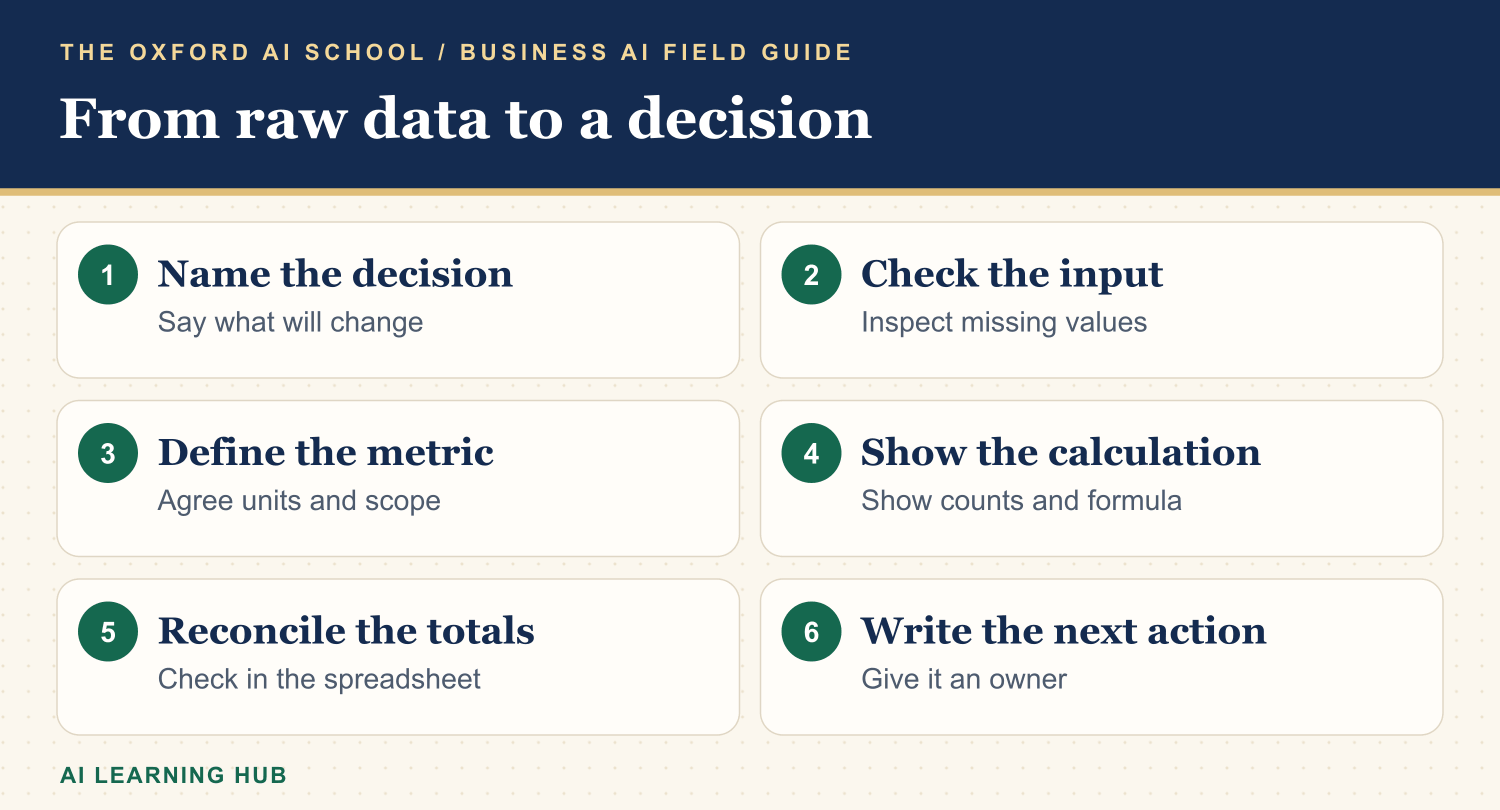
Read the infographic as text
- Name the decision: Say what will change.
- Check the input: Inspect missing values.
- Define the metric: Agree units and scope.
- Show the calculation: Show counts and formula.
- Reconcile the totals: Check in the spreadsheet.
- Write the next action: Give it an owner.
1. Audit the file before analysing it
File quality check
One row in this approved sample represents [unit]. Check for missing values, duplicate [ID], inconsistent date formats and mixed units. Report counts and five example rows. Keep blanks distinct from zeros. Suggest corrections and leave the source unchanged.
A duplicate customer ID can be perfectly normal in a sales file. A duplicate order ID might mean something else. Tell it which you expect.
2. Calculate a metric you can reproduce
Show the arithmetic
Calculate monthly conversion rate using qualified enquiries as the denominator and converted enquiries as the numerator. Group by enquiry month. Show counts and formula for each month, list exclusions and flag any zero denominator. Reconcile the counts to the supplied file.
Check one month yourself. If the conversion column uses “yes”, “won” and “W”, agree which labels qualify before trusting the percentage.
3. Investigate what changed
Explain the movement
Compare [metric] across [period A] and [period B]. Show absolute and percentage changes separately. Break down the change by [segment] using the same definitions. Flag tiny groups, partial periods and missing data. Separate observed patterns from possible explanations.
A 100% increase can mean you went from one enquiry to two. Put the counts beside the percentage and let everybody get on with their day.
4. Find a public benchmark
Benchmark with public sources
Find UK benchmarks for [metric] in [industry] for [date range]. Prefer original reports. Show sample size, population, period and metric definition beside each figure. Explain which figures are comparable with our definition [definition]. Keep private company figures out of the search.
Where definitions differ, keep the comparison descriptive. “Close enough” is rarely a satisfying footnote.
5. Look for a reason to change your mind
Challenge the conclusion
Our proposed interpretation is [claim]. Identify alternative explanations in this approved data. For each, say what you can test now and what additional data you would need. Look for seasonality, missing periods and changes in the mix of customers. Avoid claims of causation.
For example, if average order value rose after a campaign, check whether a few unusually large orders drove the change.
6. Turn the checked result into a decision brief
Write the one-page brief
Use only the verified figures below [figures and sources]. Write a one-page brief for [audience]. Give the decision, the two findings that matter, their limits and a next step with an owner. Mark unsupported points as open questions.
Keep your checked figures beside the brief. If you want to practise the workflow with your team, see AI Basics Deep Dive and the AI Policy Workshop.
Keep learning: Business AI field guides
The five-part series
More from the AI Learning Hub
Sources and product notes
Official product information checked on . Examples and prompts are for practice. Access and controls can change by plan, platform and account.
Frequently asked questions
Can I upload a CSV to Perplexity?
Supported file uploads depend on account access. Check the current plan and use approved material.
Should I let Perplexity calculate final management figures?
Use it to investigate or draft a check. Reproduce and reconcile important calculations in your approved reporting system before relying on them.
What if I cannot share company data?
Use public or synthetic data to develop the prompt. Run the real analysis in your approved environment and transfer only authorised results.